Italy
Italian Republic
Country have opposed or blocked EU plans to use or confiscate frozen Russian sovereign assets (primarily held in Belgium's Euroclear) for financing Ukraine's defense, reconstruction, or reparations and/or maintain indefinite exemptions for Russian oil imports via the Druzhba pipeline (with some ongoing gas/nuclear ties), and others sustain limited permitted trade flows amid overall ~80-90% reduction in EU-Russia commerce since 2022 (sources: Reuters, Politico, The Guardian, Responsible Statecraft, Al Jazeera, December 2025 reports).

Capital
Rome
Region
Europe
Population
58,927,633
Area (km²)
301,336
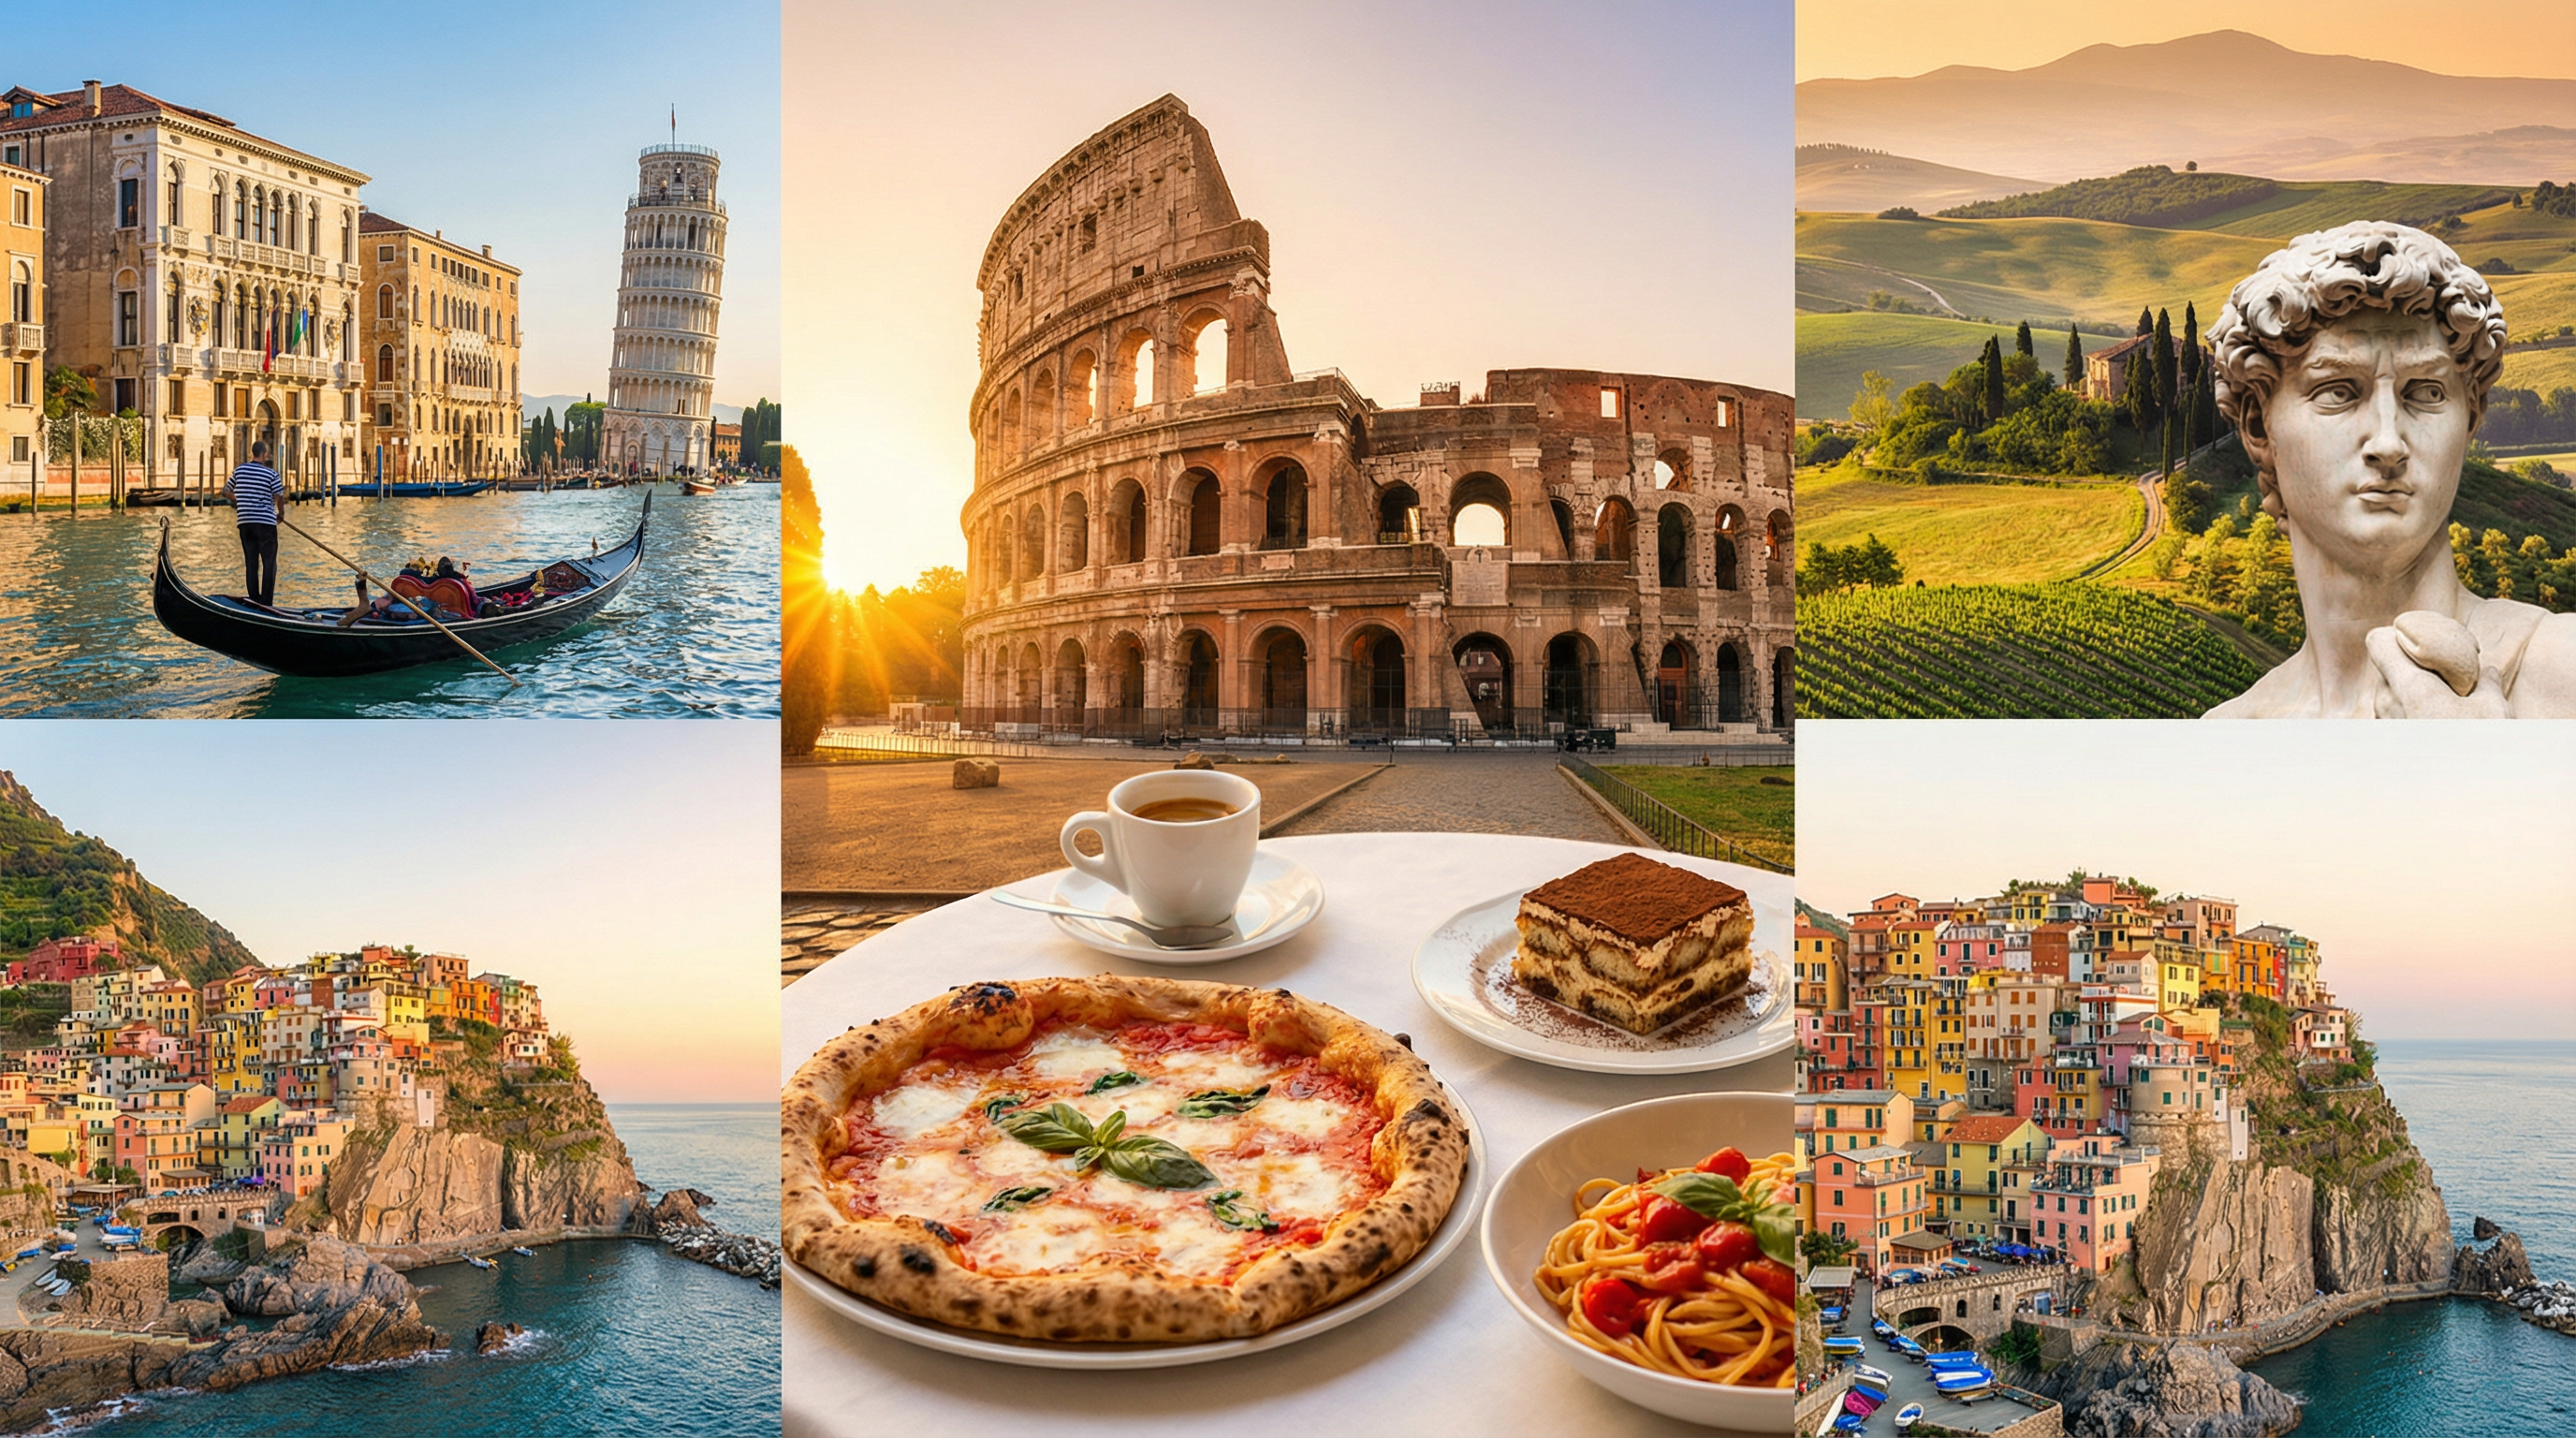
Italy, a boot-shaped nation in southern Europe, is home to 58.9 million people across 301,336 km², with Rome as its historic capital. Renowned for its ancient Roman heritage, Renaissance art, and culinary delights like pasta and pizza, it blends Alpine mountains, rolling hills, and stunning Mediterranean coastlines. Though GDP data isn't specified here, Italy thrives as a cultural and economic powerhouse in the EU.
Key Insights
As expected for a developed nation, Italy has achieved 100% access to electricity for its population. This universal access is a fundamental indicator of advanced infrastructure and development, ensuring basic energy needs are met across the entire country.
Italy is grappling with 'stagflationary' pressures characterized by high inflation (5.622%) alongside a relatively high unemployment rate (7.627%). This combination indicates persistent economic friction, where price increases are not translating into sufficient job creation or labor market efficiency.
Italy boasts one of the highest life expectancies globally at 83.70 years, coupled with an impressively low infant mortality rate of 2.300 per 1,000 live births. These figures reflect a highly effective healthcare system and high standards of living, despite health expenditure being moderate (8.518% of GDP).
Italy maintains a high-income status with a GDP per capita approaching $40,000, yet its economic growth rate is notably slow at just under 1%. This suggests structural challenges preventing faster expansion, even with significant economic output.
GDP (Current US$)
$2.32T
Year: 2023
GDP Per Capita
$39,277.08
GDP Growth (%)
0.98%
Inflation (%)
5.62%
Unemployment (%)
7.63%
Debt to GDP (%)
N/A%
Source: World Bank • Last updated: 12/24/2025
Historical Trends & Data Visualizations
- GDP Growth (%)
- Population
- Life Expectancy (years)
- Renewable Energy (%)
- GDP Per Capita ($)
Share This Country
Real Estate
Events
Government
Travel & Tourism
External References & Resources
Wikipedia
Comprehensive encyclopedia article
Grokipedia
AI-powered encyclopedia search
Google Search
Latest news and information
Google News
Latest news coverage for Italy
CIA World Factbook
Official intelligence data
BBC News
Trusted news and analysis
UN Data
Official United Nations statistics
World Bank Data
Economic and development indicators