Croatia
Republic of Croatia

Capital
Zagreb
Region
Europe
Population
3,866,233
Area (km²)
56,594
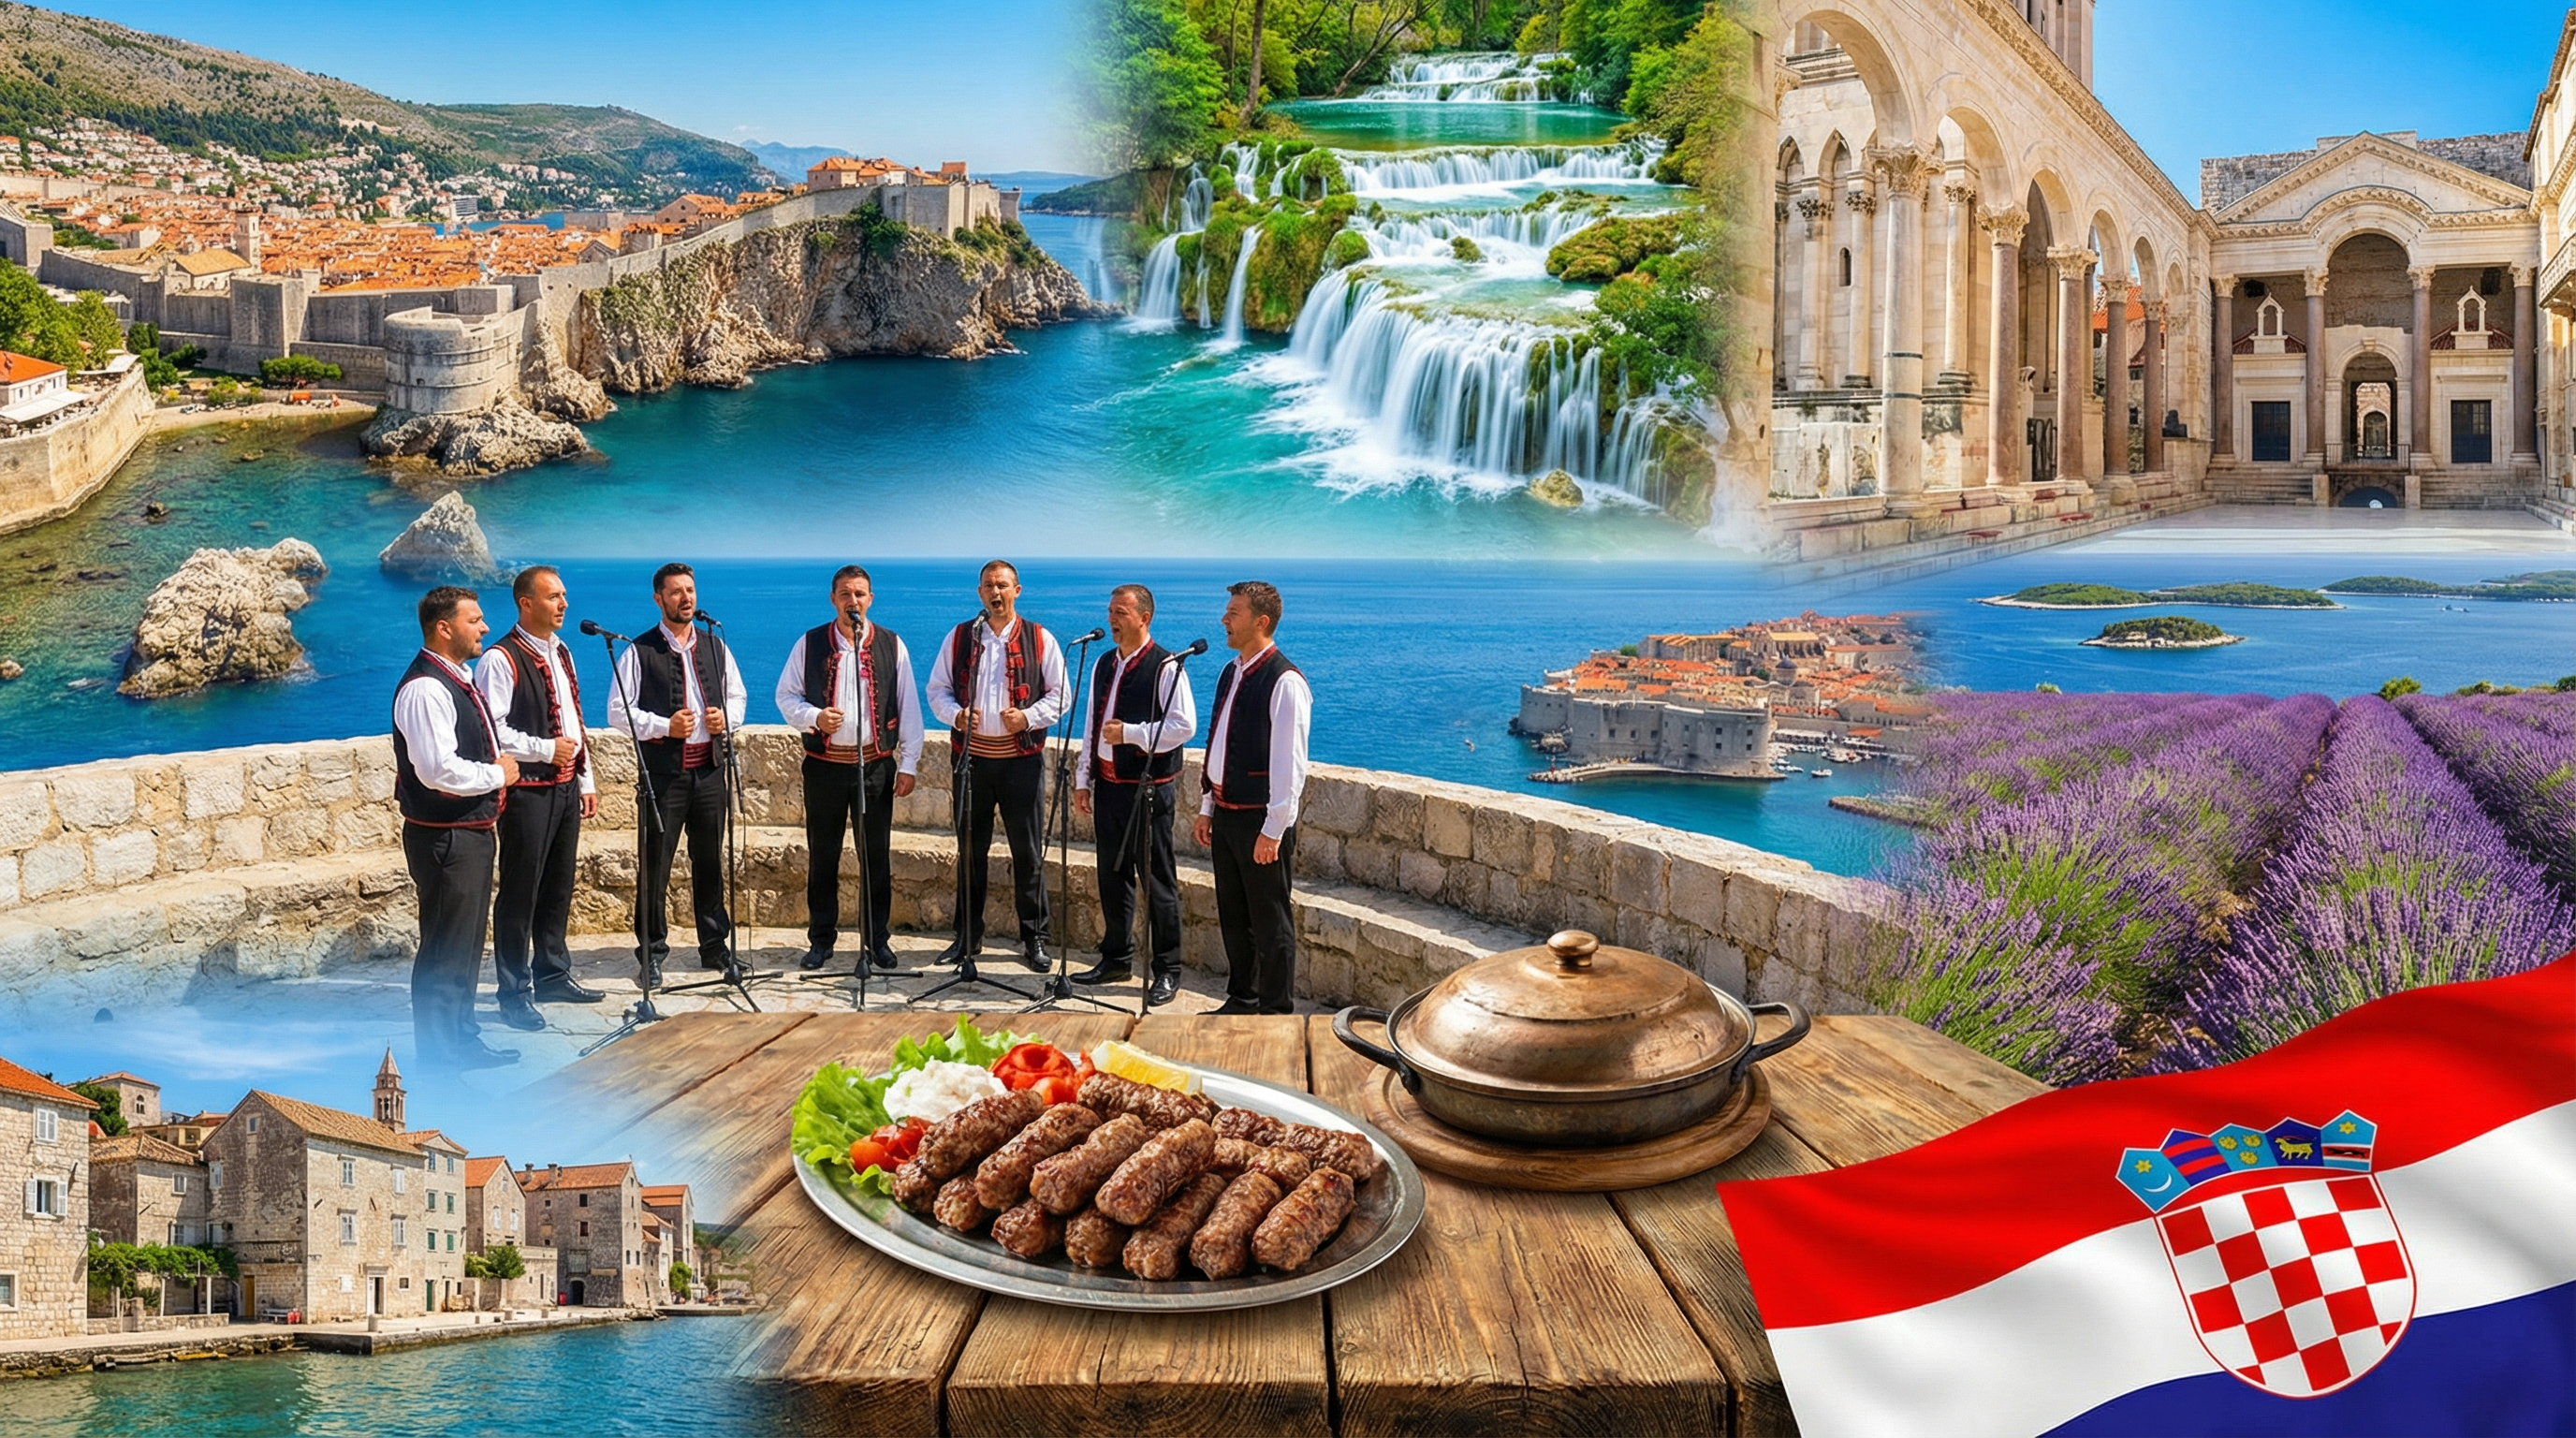
Croatia, a scenic European nation in the Balkans, boasts a population of about 3.9 million and covers 56,594 km², with Zagreb as its vibrant capital. Known for its stunning Adriatic coastline and historic sites like Dubrovnik, it's a popular tourist destination blending rich cultural heritage with natural beauty. While GDP data is unavailable here, the country thrives on tourism, shipbuilding, and EU membership since 2013.
Key Insights
Croatia has achieved universal access to electricity, a foundational development metric. Furthermore, nearly 35% of its land is covered by forests, highlighting significant natural resources and commitment to preserving green areas, likely contributing to its tourism appeal.
Croatia demonstrates excellent public health standards, evidenced by a very low infant mortality rate (3.9 per 1,000 live births). This figure is comparable to or better than many wealthier Western European nations, indicating effective healthcare access and maternal care.
Croatia's fertility rate is significantly below the replacement level of 2.1, indicating a rapidly aging population and long-term demographic challenges. This low birth rate, combined with emigration, puts pressure on social security systems and future economic productivity.
Despite high inflation and global economic uncertainty, Croatia maintained a relatively low unemployment rate of 6.086%. This suggests tight labor market conditions, likely exacerbated by population decline and high seasonal demand (tourism).
GDP (Current US$)
$85.62B
Year: 2023
GDP Per Capita
$22,184.23
GDP Growth (%)
3.76%
Inflation (%)
7.94%
Unemployment (%)
6.09%
Debt to GDP (%)
N/A%
Source: World Bank • Last updated: 12/24/2025
Historical Trends & Data Visualizations
- GDP Growth (%)
- Population
- Life Expectancy (years)
- Renewable Energy (%)
- GDP Per Capita ($)
Share This Country
News
Real Estate
Events
Government
Travel & Tourism
External References & Resources
Wikipedia
Comprehensive encyclopedia article
Grokipedia
AI-powered encyclopedia search
Google Search
Latest news and information
Google News
Latest news coverage for Croatia
CIA World Factbook
Official intelligence data
BBC News
Trusted news and analysis
UN Data
Official United Nations statistics
World Bank Data
Economic and development indicators